Methodology
Carbon Footprint Calculator
Read Article
A personal carbon footprint is the total amount of greenhouse gas emissions caused by an individual over a period of time.
Below you will find an in-depth breakdown of the scientific research used to build our carbon footprint calculator as well as a full list of the references used. You can also listen to our podcast episode below where we talk about how the calculator works, how Tiago went about building it and share some interesting principles to help you lower your footprint effectively.
Carbon dioxide equivalent
Carbon footprints are measured in the amount of carbon dioxide equivalent CO2e, the standard unit used to quantify greenhouse gas emissions. But what does this unit actually represent?
There are 7 major greenhouse gases that contribute to climate change: carbon dioxide (CO2), methane (CH4), nitrous oxide (N2O), hydrofluorocarbons (HFCs), perfluorocarbons (PFCs), sulfur hexafluoride (SF6) and nitrogen trifluoride (NF3). Some of these gases lead to more warming than others for the same amount released into the atmosphere. This is reflected in a unit called the global warming potential which allows the emissions of these greenhouse gases to be converted into the amount of CO2 that would lead to the same amount of warming over a 100 year period. Using a standard unit makes it much easier to compare the impact of activities that emit different greenhouse gases.
Emission factors
Emission factors are essential for estimating a carbon footprint, they measure the CO2e emissions per unit of activity. For example, driving a car for 1 km leads to the emission of 0.04 kg of CO2e.
Lifecycle analysis
Life cycle analysis is an approach to assess the environmental impact of a product or activity throughout its entire life cycle. For example, to estimate the carbon footprint of a smartphone you would need to assess the extraction and processing of raw materials, the manufacturing, transport, use and end of life of this product. Such in-depth studies are what allow us to estimate the carbon footprint of different products or activities and add them to your footprint in the calculator.
Estimating the carbon footprint of all you eat is not a simple task. However, enough research has been done that we can arrive at a good estimate. The carbon footprint associated with a range of food products has been estimated through life cycle analysis.
By combining the emission factors of different foods (i.e. the CO2e emitted per amount consumed) by the average consumption rate among people following different diets we can estimate dietary carbon footprints. Several independent studies have followed this approach and although they arrive at different values, there is broad consensus on one finding: the lower the consumption of animal products the smaller the dietary carbon footprint. However, until recently, most studies ignored how food consumption is driving the replacement of native vegetation and soils (which are an important carbon sink) for agricultural land and how this increases the carbon footprint of food. In a recent study (1) this effect has been incorporated into a mathematical model leading to new estimates of dietary footprints which are the values we use in our simple carbon footprint calculator.

Buying local food and reducing food miles has received much attention as a measure to reduce carbon emissions. However simply buying local food may not reduce emissions as one might expect. In some cases, less carbon is emitted by producing food elsewhere and transporting it to where you live than to grow it locally where conditions may be unfavourable. E.g. green house grown tomatoes in the UK winter vs Spanish tomatoes. Being mindful of where food comes from is still an important part of reducing our dietary footprint. In particular, avoiding food that is flown in and buying food that is both local and seasonal avoids many of these issues.
Transport has been estimated to account for about 11% of the food emissions associated with an average American diet (2) and 6% of an average global diet (3). From this we assume that, at most, by eating exclusively local and seasonal food could amount to a reduction of about 700 kg of CO2e per year.

Food waste increases an individual’s carbon footprint in two ways.
First, by buying more food than necessary all the emissions associated with producing, transporting, packaging and preparing this additional food can be substantial. This accounts for the majority of emissions associated with domestic food waste.
Second, after you dispose of food it needs to be transported, processed and managed and this leads to additional end of life emissions. The study we used to obtain the estimates for dietary carbon footprints (1) assumes that the rate at which food that would normally be eaten is thrown away is 13% and that this accounts for about 10% of the diet’s footprint. Since emissions will be directly proportional to the amount of food wasted we can use this to adjust the dietary footprints above to specific amounts of food waste. For example, for someone that eats meat a few meals per week, their dietary carbon footprint will range from 5.9 tonnes of (CO2e if they waste 0 -10% of the food they buy) to 7.6 (if they waste 20 -30%).

When materials are recycled rather than being sent to landfill, their use prevents the emissions needed to extract and process the raw materials needed to make new products and packaging. However, the additional transport and processing associated with recycling does also lead to further emissions.
We estimated the net carbon footprint savings associated with recycling comprehensively based on the latest official UK statistics on waste (4) lead to a value of 100 kg of CO2e per year, which is comparable to the values reported in another study (5).

To calculate emissions from flying we need to know the distance you fly over a year and multiply it by the appropriate emission factor (i.e. the estimate of greenhouse gas emissions per amount of distance travelled). We use the emission factors provided by the latest official report (6) by the UK Department for Business Energy & Industrial Strategy (BEIS). Several emission factors are provided, so here we explain which ones we use in the calculator and why.
We choose to use emission factors that take into account the stronger warming effect of emissions by air travel compared to other sources. There are multiple reasons for this, including the fact that air travel emissions occur at higher altitudes. There is currently no consensus on the magnitude of these effects, but it is expected to be large. All our calculations use a radiative forcing index of 1.9 as recommended by the BEIS (6) and the United Nations Framework Convention on Climate Change. See this article for a discussion of radiative forcing in aviation, and for a justification of the 1.9 multiplier see the BEIS report (6).
We have chosen emission factors provided for International flights as this is a summary measure that will provide the best estimate of the emission factor for a user without specifying the exact route or location.
We use cabin-class specific emission factors. Passengers using more spacious seating are accountable for a greater share of the aircraft’s emissions. If the space taken up by first class seats was used by economy class seats the number of passengers on the airplane could increase such that each one would be accountable for a smaller share of the total emissions. Since emission factors differ widely among different classes, it is very important to include this component in our simple carbon footprint calculator.


Do you want to have a direct impact on climate change? Sir David Attenborough said the best thing we can do is to rewild the planet. So we run reforestation and rewilding programs across the globe to restore wild ecosystems and capture carbon.
Get involvedTo estimate emissions associated with car transport we use the latest emission factors provided by BEIS (6). These are different depending on car type (Diesel, Petrol, Hybrid ,PHEV or Electric) and car size (small, medium or large). For electric cars we further adjust these emission factors based on the country and/or state of residence. Emissions associated with electricity consumption vary widely between countries and states because of the way electricity is produced, so this is a very important part of estimating the carbon footprint of driving an electric car. To illustrate, driving a medium sized electric car for 20,000 km in a year would be associated with the emission of a tonne of CO2e if electricity was bought in the UK, half a tonne if bought in Vermont, USA and about 18 tonnes if bought in Wyoming USA. We further adjust for the % of energy derived from renewable energy (see electricity emission factors below). For some countries we do not have specific emission factors in which case we use the global average.

To estimate the share of emissions you are accountable for due to car transportation we divide the total amount emitted by the car by the number of passengers.
As with cars, we use the latest emission factors for motorbike driving provided in the government BEIS report (6).
For transport by train we use the emission factor provided for national rail (6) and assume an average speed of 100 km/h
Since the difference between the emission factors provided by for light rail and London Underground are very small (6), we combine the two into a single category and use an average emission factor. We assume an average speed of 20 km/h based on data from The European Research Advisory Council. (7)
To estimate home energy emissions, we have built a database with country specific emission factors and average energy consumption levels from multiple sources (1-13).
If you chose to introduce the exact kwh of electricity you consumed (based on your electricity bill), we multiply this by the country-specific emission factor (if available, otherwise a global average) to estimate the emissions. If you choose to estimate your consumption based on averages, we assign you the average electricity consumption in your country and adjust this value depending on whether you think your consumption is above or below average. To determine above or below average consumption values we take into account studies that have analysed how much variation in electricity consumption there is between households (14).
If all the energy you use at home comes from renewable sources, we use the average emission factors for wind, solar and hydroelectric energy production provided by the IPCC (15). Although emission factors for these sources are very low, they still require infrastructure development and introduce changes in the landscape and so are not emission free. If a percentage of your electricity comes from renewable sources, the final emission factor used will be a weighted average of your country's emission factor and the one of renewable energy.
To arrive at the personal footprint from home energy we estimate the total emissions for the household and divide it by the number of household members. .
If you provide the exact consumption levels of natural gas, LPG, burning oil or wood, we estimate the emissions using the latest emission factors for each fuel (6). If you choose to estimate your consumption based on averages, we use the typical consumption values reported for European countries (16). As for electricity we split the emissions equally among household members.

The unsustainability of fast fashion has deservedly received much attention in recent years. Each clothing item has a carbon footprint and frequent buying can have a substantial impact. The Carbon Trust provides a detailed analysis of the carbon footprint of clothing items (17). From this we estimate the average carbon footprint of an item of clothing at 3 kg of CO2e and get the yearly total by multiplying it by the number of items bought. Note that this excludes the use phase emissions associated with washing and drying because these are covered in the home energy part of your footprint.

The estimates of the carbon footprint of electronic products used in our carbon footprint calculator are taken from a recent study where the average lifecycle emissions of common items has been analysed (18).

If you bought a car over the last year, we add the carbon footprint of manufacturing it (19) to your personal carbon footprint. Although you may continue to use the car in the future, this gives you a better idea of where your car’s emissions come from (production versus driving).
Your results email should give an idea of what actions will provide the greatest bang for your buck in terms of lowering your carbon footprint. However, knowing your footprint can raise more questions than it answers. You may be wondering how low your carbon footprint would have to be to prevent the worst climate change scenarios. Below are some guidelines to help you understand the broader context of your results.
To arrive at a carbon footprint target it makes sense to start by thinking about the consequences of climate change. It is only based on this information that you can judge how much this crisis matters to you and what you are willing to do to address it.
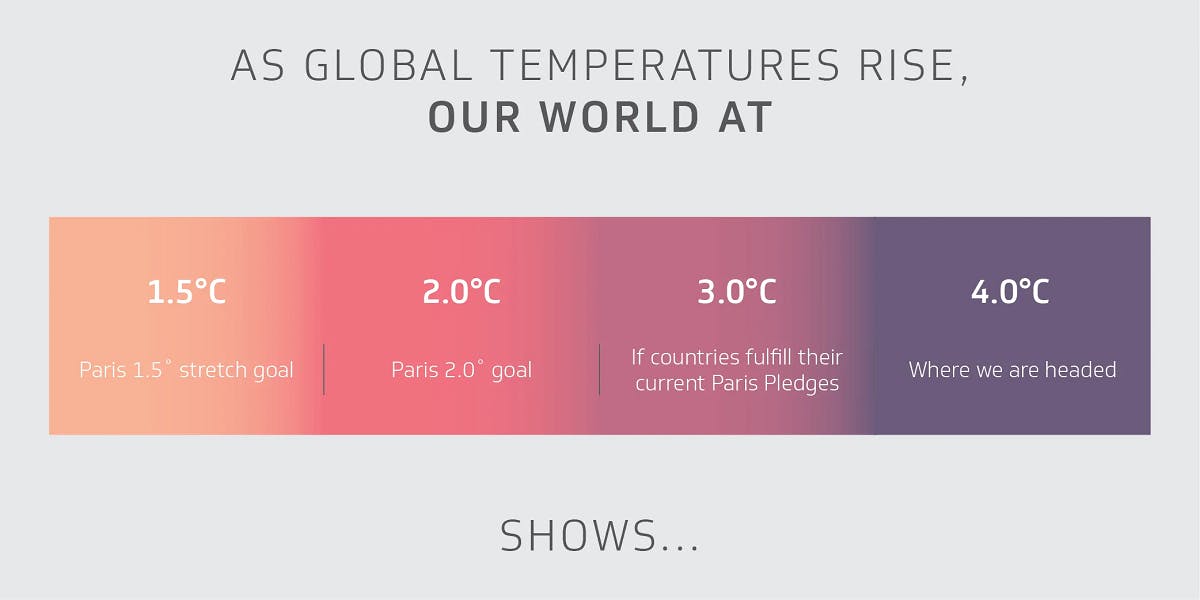
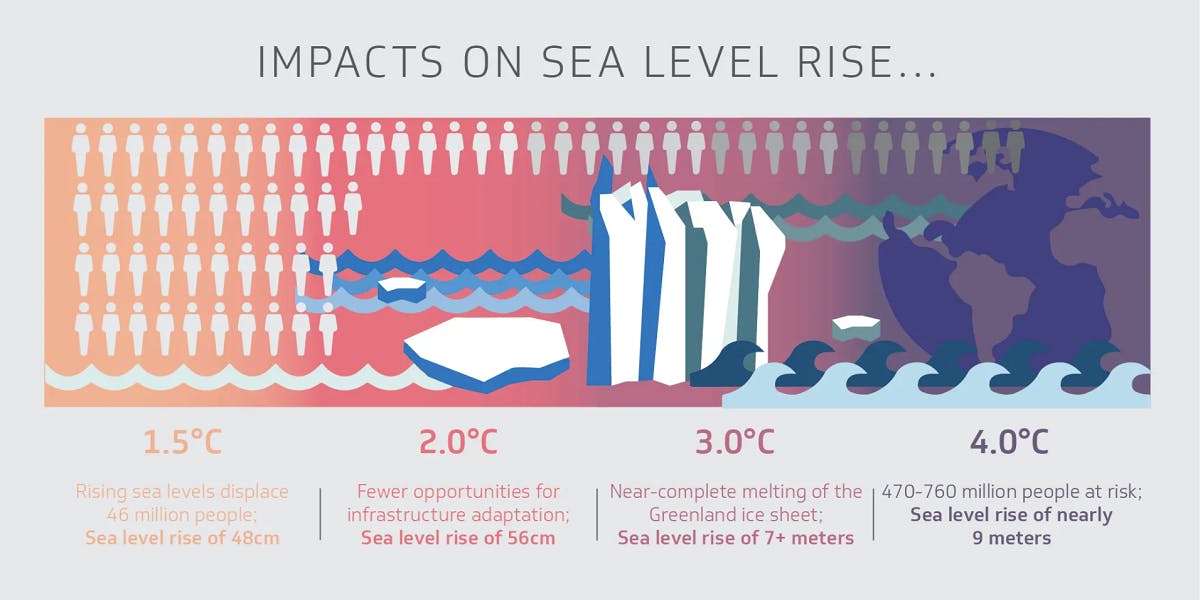
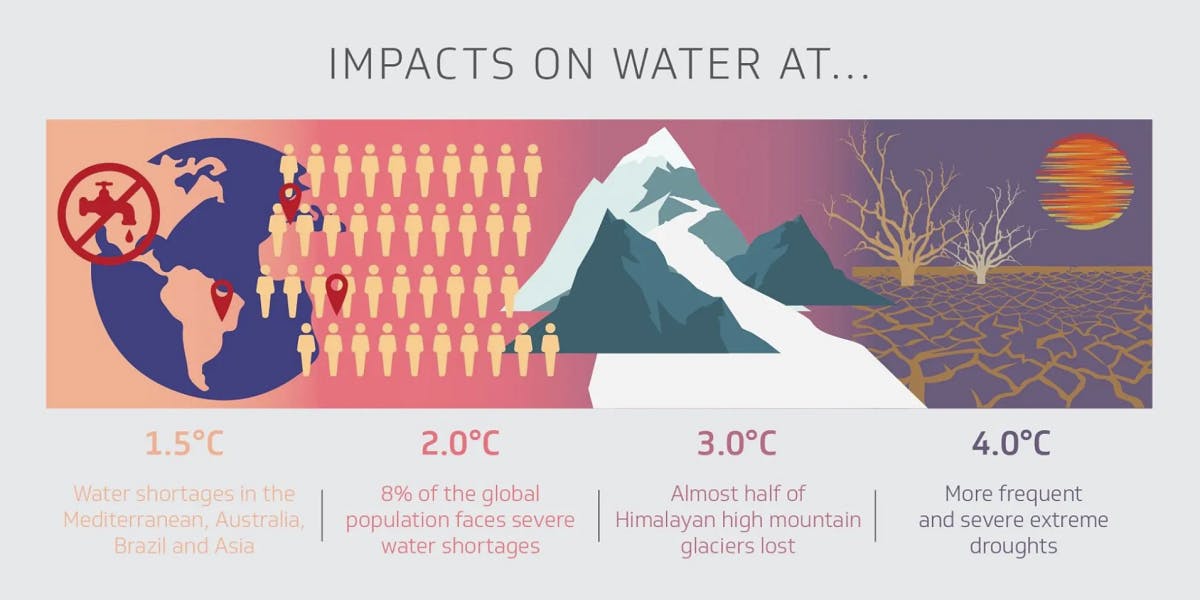
The infographic below summarises the predicted impact of different climate change scenarios. It's based on the IPCC Special Report on 1.5 °C which assessed the scientific, technical and socio-economic literature to provide a coherent picture of what may lie ahead.
One aspect that stands out from comparing the scenarios is that the difference between 1.5 °C and 2 °C is huge. Taking one example, the research suggests that in this half of a degree lies the difference between essentially all coral reefs disappearing or not. This is why the Paris agreement aims to keep global warming well below 2 °C above pre-industrial levels and to try to limit it to 1.5 °C.

Inforgraphic describing the predicted impact of different climate change scenarios.


A global carbon budget
Based on the above, it is fair to say that half a degree matters, but what kind of changes do we need to make to reach these carbon footprint targets?
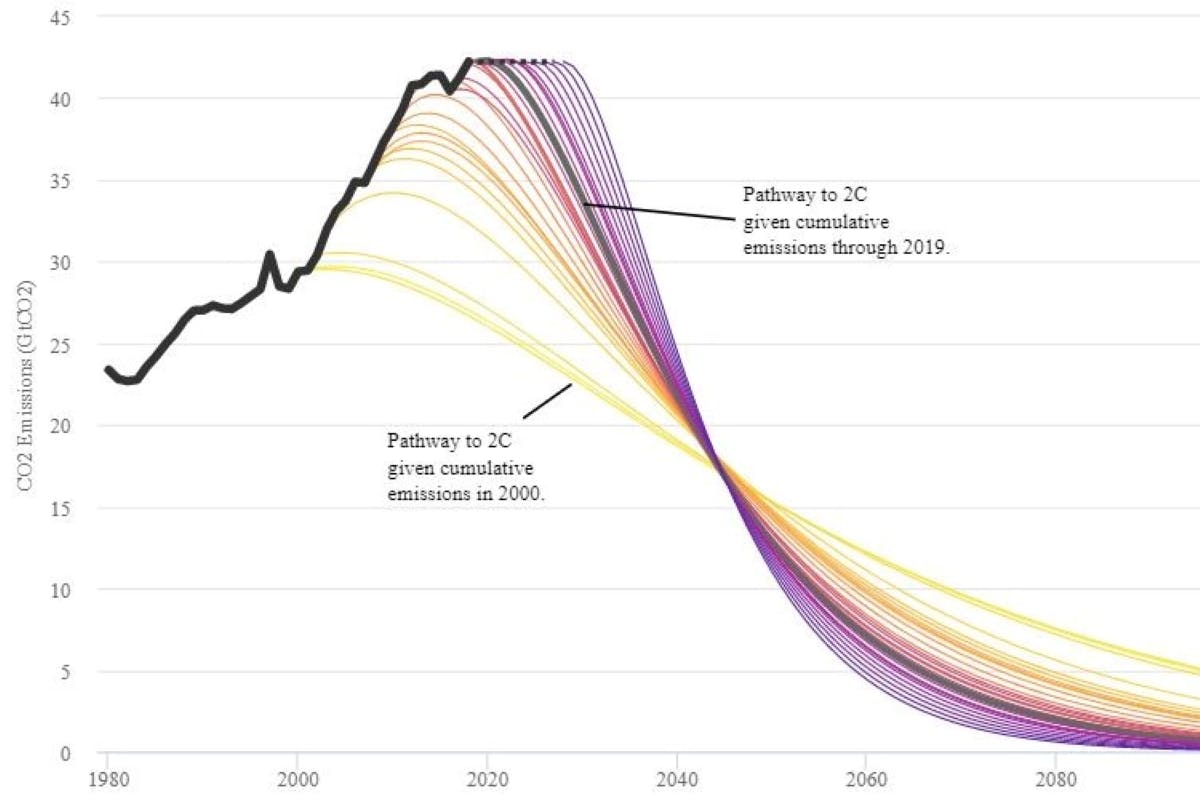
One way to think about this problem is to estimate a global carbon budget. This represents the maximum amount of greenhouse gases that the world population can emit while preventing global warming beyond 1.5 to 2 °C above pre-industrial levels. Although it is a simple concept, the carbon budget is difficult to estimate.
To address this, scientists from all around the world have been running complex simulation models that allow them to predict how the climate will respond to different emission scenarios.
While there is no question that rapid action is required, it is hard to know how much of the budget we have left. Some studies suggest we have already exhausted it while others predict that this will only occur in a couple of decades.
Still, by considering all the possible scenarios, we can get an idea of the emission reductions we need.

Personal carbon footprint targets
To understand how our personal footprint fits into this global picture requires a few extra considerations.
First, we have to divide the budget by the predicted world population size at each moment in time.
Second, we have to take into account the fact that individual lifestyle choices and consumption only account for part of all emissions. This is expected to be around 72% of global emissions based on a research article that looked at these proportions at the global level.
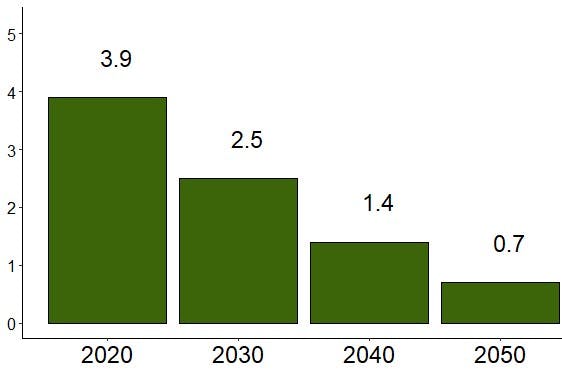
A recent report combined all this information to arrive at some very useful targets. This plot shows you the personal carbon footprint limits, in tonnes of CO2e per year, that are consistent with the Paris Agreement targets.
Useful as a simple guideline
There are a few things to keep in mind when comparing your carbon footprint to these targets. First, unlike our carbon footprint calculator, they assume that individuals are not accountable for the land use change associated with food consumption. If these components were included, the targets would be slightly less strict.
Second, this is just one of the many ways in which the carbon budget can be spread out over time. As shown by the graph on the left, the later we start reducing our emissions the steeper the reductions have to be to stay on target. Conversely, the slower we are to change, the greater the burden we are leaving for the future.
Despite the caveats, these carbon footprint targets should give you a good idea of the kind of change that needs to take place and how your personal carbon footprint fits into the bigger picture.
Most people in wealthy nations will be well above these targets but that should not be demotivating, here are 5 reasons why.
1. The higher your footprint the more opportunities to have a big impact
If you have a large carbon footprint there are probably many different lifestyle changes that you can make that will have a big impact. Therefore, it is more likely that you will be able to slice your footprint substantially without much effort at all by choosing the measures that you can implement right now.
2. Climate change is not either or
The relationship between emissions and climate change is continuous by its very nature so don’t get too bogged down by the targets. While we aim for 1.5 °C things get progressively worse at 2, 3 and 4 °C. It is never a lost battle, it is an ongoing one where every bit counts!
3. There are many ways to fight the climate crisis
For some people it can be very hard to implement the necessary lifestyle changes. However they can still take action on the climate by means of their influence on society. This can be achieved through voting, activism, investment in climate solutions, divestment from polluting industries and talking about the issue with family and friends to list just a few. Although we can’t accurately measure the impact of many of these measures it doesn’t mean they are less important. On top of this, by becoming a mossy earth member you can plant 40 native trees per year which will be absorbing carbon dioxide for years to come.
4. You get to choose your own pace
Some people are happy to make big sudden lifestyle changes to lower their footprint. However, for most, a steady incremental approach probably works best. What matters is what you achieve on average and in the long-term so it is important to aim for sustainable habit changes.
5. You don’t have to be a climate saint to have an impact
Which lifestyle changes have the biggest impact and which are the hardest to implement will vary a lot from person to person (to learn some of the reasons why check out our podcast). Navigating this map of opportunities is a personal process and you shouldn’t feel like a hypocrite if you are making big changes in one part of your lifestyle but not another.
